Line charts are one of the most commonly used data visualizations, perfect for displaying data points connected by a continuous line. They are primarily used to show trends, patterns, or changes over time, making them invaluable for time-series data. The straightforward structure of a line chart allows users to quickly identify upward or downward trends, cyclical patterns, and other insights.
General Overview of Line Charts
Visualization Name: Line Chart
Visualization Category: Temporal
Types of Line Charts
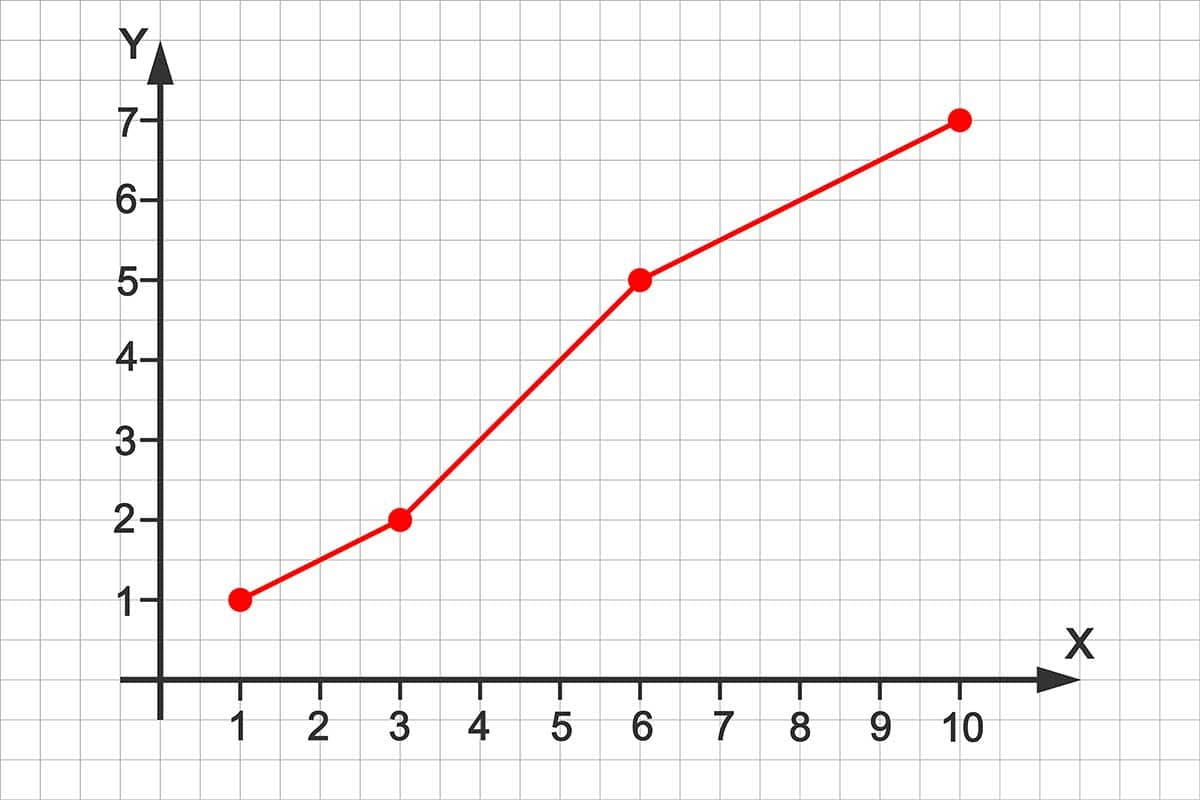
- Simple Line Chart: A single line that represents one data series, used for analyzing one variable over time.
- Multi-Line Chart: Multiple lines representing different datasets for comparison across the same categories or time intervals.
- Stacked Line Chart: Displays multiple data series stacked on top of each other to show cumulative totals.
- Smooth Line Chart: Uses curves instead of straight lines for a polished, aesthetic representation of trends.
- Step Line Chart: Uses stepped lines instead of diagonal ones to emphasize changes between intervals.
Definition of Use Case
Line charts are used to show trends or changes over a continuous interval, such as time. They are especially effective for tracking variables like revenue, temperature, stock prices, and more.
Why Use a Line Chart?
Line charts excel at visualizing trends and changes over time. They enable easy comparison between datasets, making them a go-to choice for presenting data to track progress or spot seasonal patterns.
Significance in Data Analysis
Line charts are indispensable tools in data analysis for uncovering trends, making forecasts, and identifying correlations. They are widely used in fields such as finance, marketing, and scientific research.
Structure and Components of a Line Chart
Key Elements
- X-Axis (Categories): Represents the time intervals or categories being measured.
- Y-Axis (Values): Displays the numerical values corresponding to the data points.
- Data Points: Individual points that represent values for a specific time or category.
- Lines: Connect the data points to illustrate trends or changes over time.
- Legend: Identifies different data series in multi-line charts.
- Gridlines: Help with aligning data points and comparing values across categories.
Usage Scenarios
When to Use a Line Chart?
- Trend Analysis: Tracking sales growth over months or years.
- Performance Metrics: Analyzing website traffic trends over time.
- Stock Market Analysis: Displaying daily stock prices or indices.
- Scientific Data: Showing temperature changes or experiment results over time intervals.
- Seasonal Patterns: Observing recurring trends, such as holiday sales spikes.
When Not to Use a Line Chart?
- Categorical Data: Bar charts are better for comparing categories without a continuous flow.
- Part-to-Whole Relationships: Pie or stacked bar charts are more effective for displaying proportions.
- Too Many Data Series: Overlapping lines can make the chart cluttered and hard to interpret.
- Sparse Data Points: Scatter plots are better for visualizing non-continuous data.
- Non-Sequential Data: Line charts rely on order; unordered categories are better visualized with bar charts.
Interpretation Guidelines
- Identify Trends: Look for upward or downward patterns to understand growth or decline over time.
- Analyze Peaks and Troughs: Spot maximum and minimum points to identify highs and lows in the data.
- Compare Lines: In multi-line charts, observe differences or correlations between datasets.
- Follow Axis Labels: Ensure the axes are scaled correctly to avoid misinterpreting the data.
- Examine Breakpoints: Identify sudden changes in direction, which could indicate key events or shifts.
Strengths and Weaknesses of Line Charts
Advantages
- Clear Trend Visualization: Makes it easy to observe changes over time.
- Effective for Comparison: Multi-line charts allow direct comparison of different datasets.
- Intuitive and Simple: Easy for most audiences to understand and interpret.
- Space-Efficient: Displays a lot of information in a compact format.
- Versatile: Works across industries, from finance to marketing and beyond.
Limitations
- Cluttered with Many Lines: Too many data series can make the chart difficult to read.
- Misleading Trends: Improper scaling or missing data points can distort insights.
- Overemphasis on Continuity: Assumes a continuous flow, which may not always apply.
- Limited Detail for Individual Points: Doesn’t focus on the granularity of single data points.
- Sensitive to Scale: Poorly chosen scales can exaggerate or minimize trends.
Design Best Practices
- Choose Appropriate Scales: Ensure axes are scaled accurately and start at zero when necessary.
- Limit Data Series: Avoid clutter by restricting the number of lines in a single chart.
- Use Consistent Colors: Assign distinct colors to each dataset and use a legend for clarity.
- Highlight Key Points: Use markers, labels, or annotations to emphasize critical data points.
- Label Axes Clearly: Provide descriptive labels for both axes to ensure accurate interpretation.
Examples of Line Charts
Simple Examples
- Monthly Revenue: A single line showing sales figures over 12 months.
- Website Traffic: Tracking daily visitors to a website over a week.
- Temperature Changes: A line chart showing daily temperature variations for a month.
- Stock Prices: Displaying the closing prices of a stock over a week.
- Fitness Progress: A line chart tracking weight loss over several weeks.
Advanced Examples
- Market Trends: Multi-line chart comparing sales trends across different product categories over a year.
- Energy Usage: Line chart showing electricity consumption segmented by time of day over a week.
- COVID-19 Cases: Displaying trends in daily infections across multiple regions over months.
- Climate Change: Tracking CO2 emissions levels over decades with trendlines for comparison.
- Project Performance: Multi-line chart comparing project timelines and milestones across departments.
Comparison with Similar Visualizations
Similarities
- Line vs. Bar Charts: Both compare values over categories, but line charts focus on trends, while bar charts highlight static comparisons.
- Line vs. Area Charts: Both show trends over time; however, area charts fill the space under the line for added emphasis on magnitude.
- Line vs. Scatter Plots: Both display individual data points, but line charts connect points to show continuity, while scatter plots analyze relationships.
- Line vs. Stacked Line Charts: Both display trends, but stacked line charts focus on cumulative totals across datasets.
- Line vs. Radar Charts: Both can compare multiple datasets, but radar charts are circular, focusing on categories rather than time.
Differences
- Line vs. Bar Charts: Line charts emphasize continuity over time, while bar charts are better for categorical comparisons.
- Line vs. Area Charts: Line charts prioritize trend clarity, while area charts add emphasis on magnitude with shaded areas.
- Line vs. Scatter Plots: Scatter plots are better for visualizing correlations, while line charts emphasize trends.
- Line vs. Stacked Line Charts: Stacked line charts visualize cumulative data, while line charts focus on individual datasets.
- Line vs. Radar Charts: Radar charts are less suited for time-series data, focusing instead on multiple categories at once.
Conclusion
Line charts remain a cornerstone in data visualization, offering a clear and intuitive way to observe trends and changes over time. Their versatility and simplicity make them ideal for various applications across industries, from financial forecasting to scientific research. By adhering to best practices and understanding their limitations, line charts can effectively communicate meaningful insights and drive data-driven decisions.