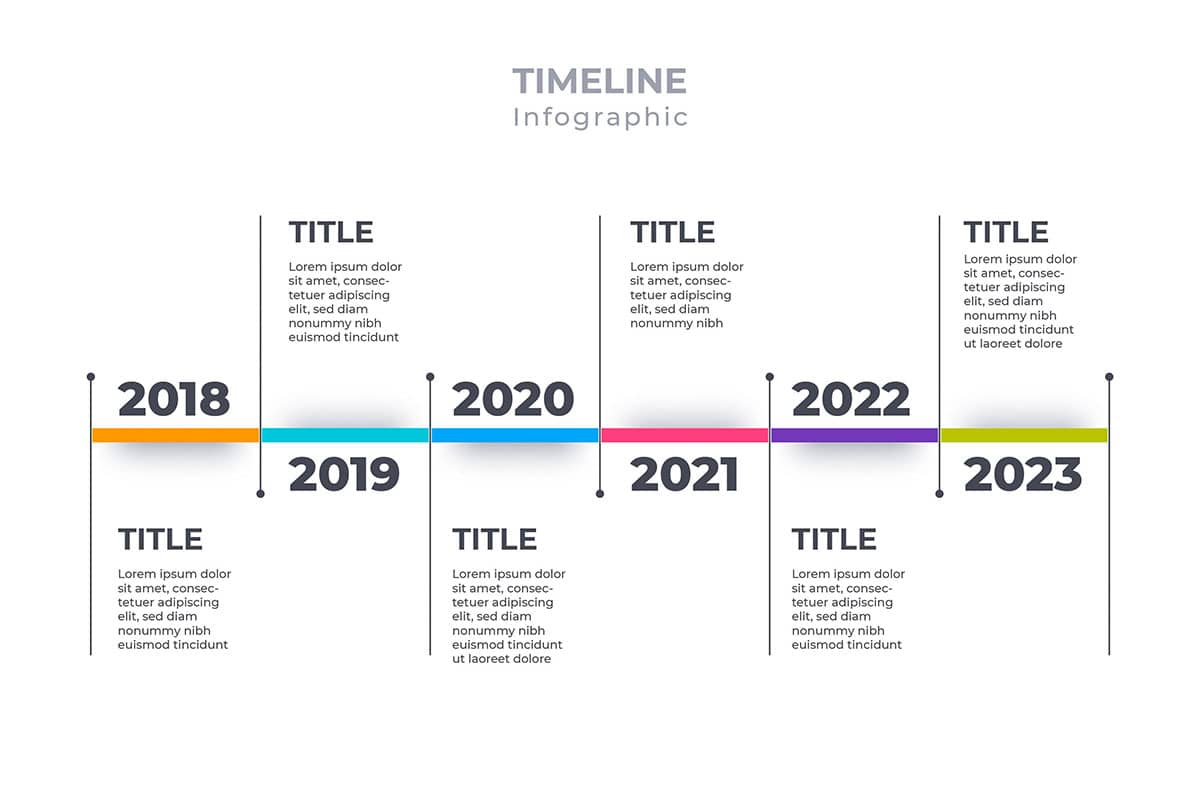
A timeline is a data visualization tool that displays a sequence of events or milestones in chronological order. It is commonly represented as a horizontal or vertical line with markers indicating key dates, durations, or occurrences. Timelines are widely used in project management, historical analysis, and storytelling to provide a clear, linear representation of time-based data.
General Overview of Timelines
Visualization Name: Timeline
Visualization Category: Temporal
Types of Timelines
- Linear Timeline: Displays events sequentially along a straight line, commonly used for historical or project data.
- Chronological Timeline: Focuses specifically on arranging events in chronological order with precise dates or times.
- Horizontal Timeline: Represents events along a horizontal axis, ideal for concise overviews of time-bound data.
- Vertical Timeline: Displays events vertically, often used for more detailed annotations or limited horizontal space.
- Interactive Timeline: Allows users to scroll, zoom, or click on events to explore details dynamically.
Definition of Use Case
Timelines are used to visualize sequences of events, processes, or changes over time. They are ideal for communicating project schedules, historical progressions, or the evolution of concepts.
Why Use a Timeline?
Timelines provide a clear and intuitive way to represent temporal data, making it easy to identify trends, milestones, or progressions. They are highly versatile and suitable for a wide variety of contexts, from education to business.
Significance in Data Analysis
Timelines help in understanding how events unfold over time, identifying patterns, and correlating occurrences. They are valuable for both exploratory analysis and presenting findings in a visually appealing format.
Structure and Components of a Timeline
Key Elements
- Axis: Represents the flow of time, typically labeled with dates, times, or periods.
- Markers: Points along the axis that indicate specific events, milestones, or occurrences.
- Annotations: Text or icons providing additional context or details about each event or milestone.
- Duration Bars: Optional elements showing the length of time between events or phases.
- Color Coding: Used to categorize events or highlight specific themes or types of data.
Usage Scenarios
When to Use a Timeline?
- Project Management: Visualizing project schedules, deadlines, and task sequences.
- Historical Analysis: Representing the progression of historical events, such as wars, inventions, or social movements.
- Product Development: Tracking the timeline of product design, testing, and launches.
- Event Planning: Mapping out key activities and milestones for an event, such as a conference or wedding.
- Process Improvement: Documenting changes or iterations in workflows or processes over time.
When Not to Use a Timeline?
- Non-Sequential Data: Use tables or bar charts for data that doesn’t follow a chronological order.
- Complex Interactions: Network diagrams or flowcharts may be better for visualizing intricate dependencies.
- Quantitative Comparisons: Bar or column charts are more effective for comparing numerical values.
- Dynamic Data: Dashboards or dynamic visualizations are better for real-time updates or constantly changing data.
- Hierarchical Data: Treemaps or organizational charts are more appropriate for structured hierarchies.
Interpretation Guidelines
- Read the Axis: Start by understanding the timeline’s scale and units (e.g., years, months, or days).
- Focus on Markers: Examine key points along the axis to identify significant events or milestones.
- Analyze Durations: Observe gaps or overlaps between events to understand timelines and dependencies.
- Interpret Annotations: Use provided labels or notes to gain additional context about each event.
- Look for Patterns: Identify trends, recurring events, or sequences that highlight broader insights.
Strengths and Weaknesses of Timelines
Advantages
- Chronological Clarity: Provides a straightforward representation of events or milestones in time.
- Easy Interpretation: Simple and intuitive for most audiences to understand.
- Customizable: Can include annotations, colors, or icons to convey additional information effectively.
- Versatile Applications: Suitable for a wide range of fields, from education to business analytics.
- Supports Storytelling: Helps narrate events or processes in a coherent and engaging manner.
Limitations
- Space Constraints: Detailed timelines with many events can become cluttered or hard to read.
- Static Representation: Does not show dynamic changes without interactive elements.
- Limited Comparisons: Not suitable for analyzing numerical or quantitative data directly.
- Over-Simplification: May oversimplify complex relationships or dependencies between events.
- Requires Context: Timelines often need accompanying explanations for detailed interpretation.
Design Best Practices
- Choose an Appropriate Scale: Select a scale that fits the time range and level of detail required for your data.
- Label Clearly: Provide concise and informative labels for events, durations, and axes.
- Highlight Key Events: Use color, icons, or font size to emphasize important milestones or dates.
- Maintain Simplicity: Avoid overcrowding the timeline with too many events or excessive details.
- Enable Interactivity: Add zoom, scroll, or hover features for complex or detailed timelines.
Examples of Timelines
Simple Examples
- Project Plan: Displaying key deadlines, milestones, and task durations for a project.
- Historical Events: Highlighting significant moments in world history, such as the Industrial Revolution.
- Personal Goals: Mapping out personal milestones, such as fitness achievements or educational goals.
- Product Launch: Tracking the stages of a product’s development, from ideation to release.
- Event Schedule: Laying out activities and timings for a conference or festival.
Advanced Examples
- Software Development: Mapping Agile sprints, deliverables, and feature rollouts over several months.
- Company Roadmap: Visualizing a business’s strategic goals, product launches, and key initiatives over several years.
- Scientific Research: Tracking the timeline of experiments, data collection, and findings publication.
- Historical Analysis: Displaying the progression of technological advancements or cultural movements over centuries.
- Marketing Campaign: Representing campaign phases, content launches, and performance reviews over a quarter.
Comparison with Similar Visualizations
Similarities
- Timeline vs. Gantt Chart: Both visualize time-based data, though timelines are simpler and less detailed than Gantt charts.
- Timeline vs. Milestone Chart: Both highlight key dates or events, though timelines include additional context about durations or sequences.
- Timeline vs. Calendar View: Both show dates and events, though timelines focus on sequential flow rather than specific days.
- Timeline vs. Line Chart: Both represent changes over time, though timelines focus on events rather than quantitative trends.
- Timeline vs. Roadmap: Both show plans over time, though roadmaps are often broader and focused on strategy.
Differences
- Timeline vs. Gantt Chart: Gantt charts are better for tracking tasks and dependencies, while timelines focus on milestones and sequences.
- Timeline vs. Milestone Chart: Milestone charts emphasize critical dates, while timelines provide a broader chronological context.
- Timeline vs. Calendar View: Calendars are ideal for daily or weekly planning, while timelines highlight long-term progressions.
- Timeline vs. Line Chart: Line charts analyze quantitative changes, while timelines narrate events.
- Timeline vs. Roadmap: Roadmaps focus on strategic objectives, while timelines represent chronological data flow.
Conclusion
Timelines are a powerful and versatile tool for visualizing sequences of events, milestones, and processes. Their clarity and simplicity make them ideal for storytelling, planning, and analysis in a wide range of contexts. By following design best practices and adapting timelines to the audience and data, you can effectively communicate time-based information in a compelling and engaging way.