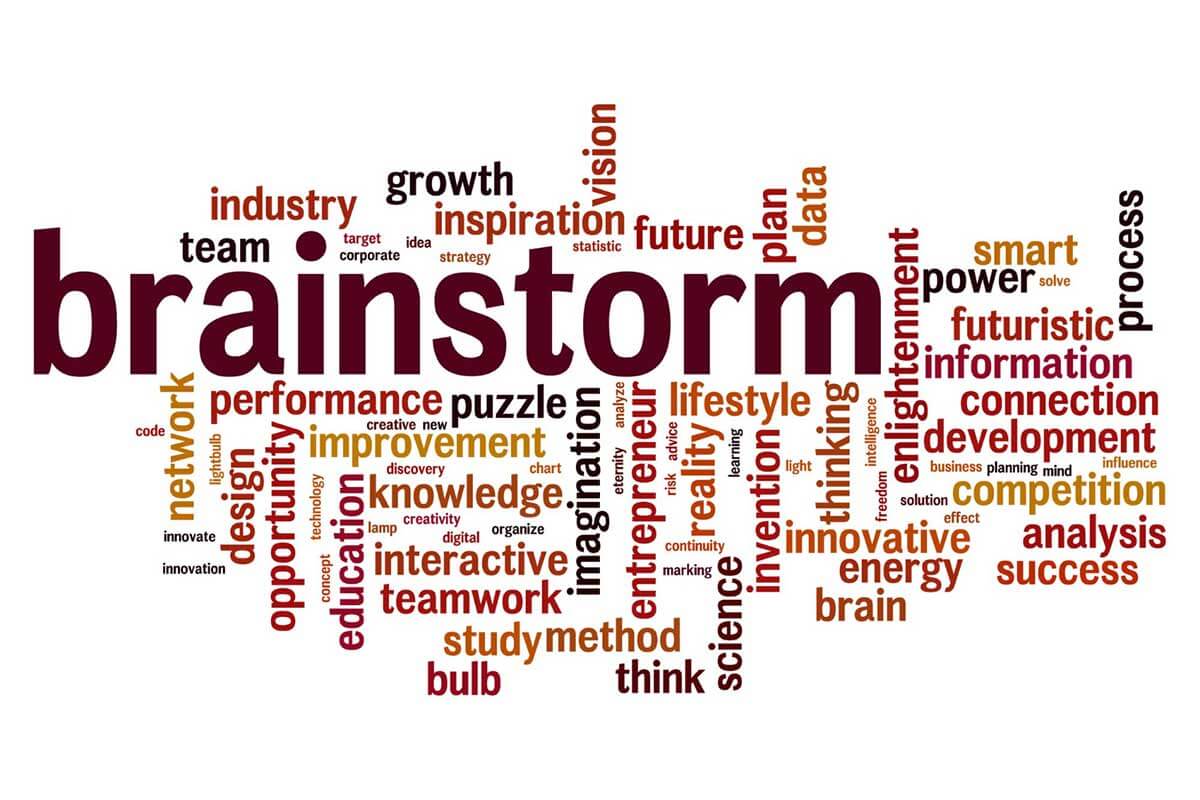
A word cloud, also known as a tag cloud, is a data visualization technique used to represent textual data. In a word cloud, words are displayed in varying sizes, colors, or orientations based on their frequency or importance in the dataset. It is a visually engaging tool often used to summarize large volumes of text data or highlight key terms.
General Overview of Word Clouds
Visualization Name: Word Cloud
Visualization Category: Textual
Types of Word Clouds
- Frequency Word Cloud: Displays words sized proportionally to their frequency in the text.
- Category-Based Word Cloud: Groups words by category, with colors or shapes representing different groups.
- Thematic Word Cloud: Tailors the word cloud to a specific theme, using related shapes or designs (e.g., a cloud for weather-related terms).
- Interactive Word Cloud: Allows users to click on words for deeper insights, such as context or associated terms.
- Time-Based Word Cloud: Animates or displays changes in word frequency over time to highlight trends.
Definition of Use Case
Word clouds are primarily used to visualize the relative prominence of words within a dataset, such as a document, social media posts, or survey responses. They are ideal for identifying dominant themes or key topics quickly.
Why Use a Word Cloud?
Word clouds provide a visually appealing and intuitive way to summarize textual data. They make it easy to identify common terms and themes, especially for large datasets, making them ideal for quick analysis or presentations.
Significance in Data Analysis
Word clouds play a significant role in exploratory data analysis, offering a starting point for understanding unstructured text data. They are also useful for communicating insights visually to a broad audience, including non-technical users.
Structure and Components of a Word Cloud
Key Elements
- Words: Represent terms from the dataset, displayed with varying sizes or colors based on frequency or relevance.
- Font Sizes: Indicate the importance or frequency of each word; larger fonts represent more frequent or significant terms.
- Colors: Enhance the visual appeal and can also represent categories or sentiments.
- Shapes: Define the overall outline or structure of the word cloud (e.g., circular, rectangular, thematic shapes).
- Orientation: Varies the layout of words (horizontal, vertical, or angled) to create a more dynamic appearance.
Usage Scenarios
When to Use a Word Cloud?
- Survey Analysis: Summarizing open-ended survey responses to identify common themes or sentiments.
- Text Summarization: Extracting key terms from articles, reports, or books.
- Social Media Analysis: Highlighting the most common hashtags, keywords, or phrases in social media posts.
- Event Feedback: Visualizing key takeaways or feedback from event participants.
- Customer Insights: Analyzing customer reviews or feedback to identify frequently mentioned products or features.
When Not to Use a Word Cloud?
- Precise Quantitative Analysis: Word clouds lack the ability to provide exact numerical comparisons or trends.
- Small Datasets: For datasets with limited text, other methods like lists or tables are more effective.
- Complex Context: Word clouds fail to show relationships or context between words, which is better achieved with co-occurrence networks or topic modeling.
- Time-Series Data: Line or area charts are more appropriate for visualizing changes over time.
- Hierarchical Data: Treemaps or sunburst charts are better suited for representing hierarchical relationships.
Interpretation Guidelines
- Focus on Larger Words: Larger words indicate higher frequency or importance in the dataset.
- Analyze Color Usage: If colors are used to represent categories or sentiments, consider their meanings when interpreting the cloud.
- Look for Themes: Identify clusters of related words to understand the dominant topics or themes.
- Cross-Check Terms: Ensure key terms align with the context of the dataset and aren’t skewed by irrelevant words (e.g., “and,” “the”).
- Consider Shape: Thematic shapes may provide additional context or relevance to the dataset being analyzed.
Strengths and Weaknesses of Word Clouds
Advantages
- Visual Appeal: Provides an eye-catching and engaging way to present textual data.
- Simplicity: Easy to create and interpret, making them suitable for quick analysis and presentations.
- Text Summarization: Offers a high-level summary of text data, highlighting key terms or themes.
- Customization: Allows for creative designs with different shapes, colors, and layouts.
- Exploratory Insights: Serves as a starting point for understanding large or unstructured text datasets.
Limitations
- Lacks Context: Does not show relationships or co-occurrence between words.
- Overlooks Rare Words: Important but infrequent terms may be omitted or minimized.
- Not Quantitative: Provides a qualitative view rather than exact numerical insights.
- Bias Toward Common Words: Dominant terms may overshadow nuanced insights, especially if stopwords are not removed.
- Static Representation: Fails to show trends or changes over time without additional visual elements.
Design Best Practices
- Filter Stopwords: Remove common words like “and,” “the,” or “is” to ensure meaningful terms are emphasized.
- Choose a Clear Font Size Scale: Use size scaling that effectively differentiates between high- and low-frequency terms.
- Use Relevant Colors: Apply colors meaningfully to represent categories, sentiments, or emphasis.
- Select an Appropriate Shape: Use thematic shapes that align with the dataset or audience (e.g., a heart shape for customer feedback).
- Limit Overcrowding: Avoid including too many words, which can make the cloud visually cluttered and hard to interpret.
Examples of Word Clouds
Simple Examples
- Survey Feedback: Visualizing common responses from an employee satisfaction survey.
- Social Media Hashtags: Highlighting frequently used hashtags from a campaign’s social media data.
- Customer Reviews: Summarizing terms from product reviews, such as “quality,” “durable,” or “expensive.”
- Book Analysis: Displaying the most common words from a novel or report to identify themes.
- Event Highlights: Creating a word cloud of key phrases from event attendee feedback forms.
Advanced Examples
- Political Speech Analysis: Visualizing the most common themes and words from a series of political speeches.
- Brand Sentiment Analysis: Displaying key terms associated with positive or negative sentiments in customer feedback.
- Academic Research: Summarizing keywords or topics from a collection of research papers or journal articles.
- Trending Topics: Visualizing terms from social media or news articles to highlight current trends.
- Product Launch Feedback: Creating a word cloud from feedback collected after a product launch to identify common likes and dislikes.
Comparison with Similar Visualizations
Similarities
- Word Cloud vs. Bar Chart: Both can show frequency or prominence, though bar charts offer precise values.
- Word Cloud vs. Treemap: Both visualize part-to-whole relationships, though treemaps use rectangles instead of words.
- Word Cloud vs. Heatmap: Both use visual intensity (e.g., size or color) to represent data magnitudes.
- Word Cloud vs. Scatter Plot: Both summarize datasets, though scatter plots focus on relationships between variables.
- Word Cloud vs. Bubble Chart: Both use size to emphasize importance, though bubble charts arrange data spatially instead of as text.
Differences
- Word Cloud vs. Bar Chart: Word clouds provide qualitative insights, while bar charts offer exact numerical comparisons.
- Word Cloud vs. Treemap: Treemaps display hierarchical data, whereas word clouds summarize unstructured text.
- Word Cloud vs. Heatmap: Heatmaps focus on relationships in a matrix, while word clouds summarize frequency or prominence in text data.
- Word Cloud vs. Scatter Plot: Scatter plots show numerical relationships, while word clouds visualize text data without relationships.
- Word Cloud vs. Bubble Chart: Bubble charts emphasize numerical data and categories, while word clouds highlight text frequency or relevance.
Conclusion
Word clouds are a powerful and visually appealing tool for summarizing and presenting textual data. Their ability to highlight key themes and dominant terms makes them a go-to solution for exploratory analysis, especially for large text datasets. However, they should be complemented by other visualization methods when precise quantitative analysis or context is needed. With thoughtful design and filtering, word clouds can effectively communicate insights to a wide range of audiences.