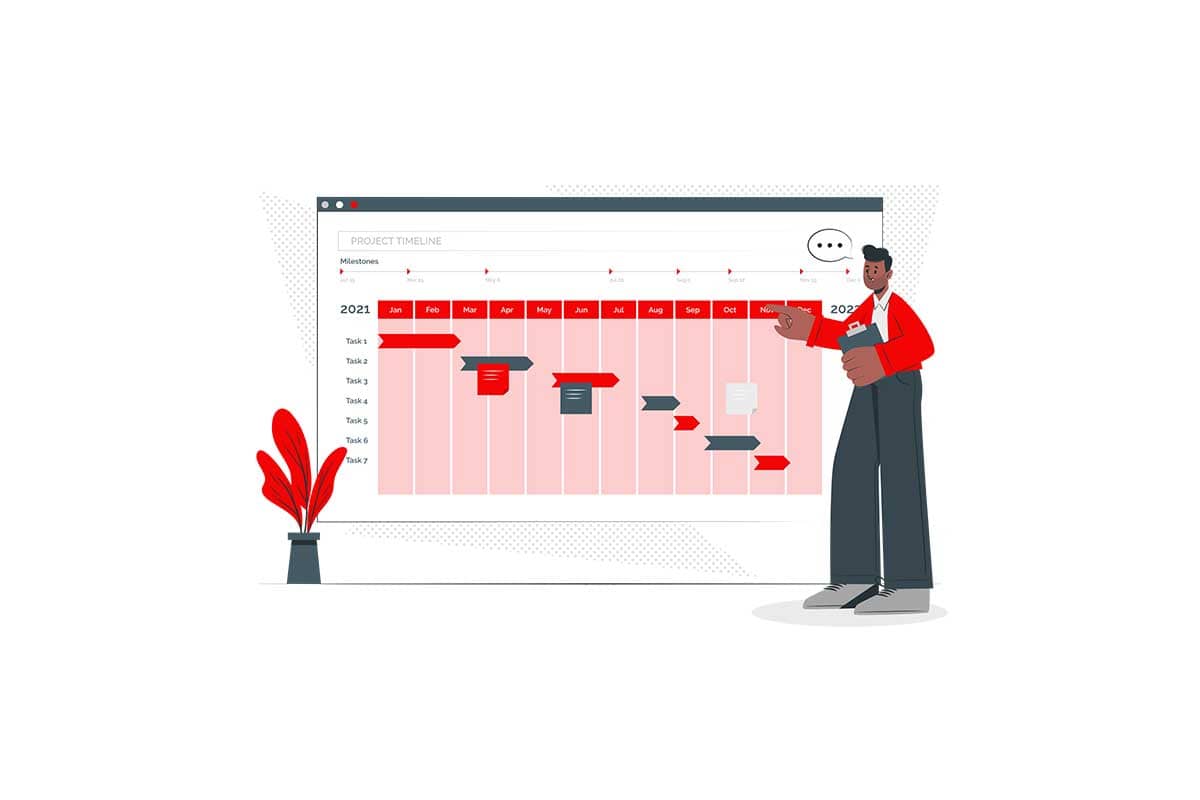
A Gantt chart is a type of bar chart used to visualize project schedules by illustrating tasks, their durations, and their dependencies. It displays tasks as horizontal bars along a timeline, with the start and end dates clearly marked. Widely used in project management, Gantt charts provide an intuitive way to track progress, allocate resources, and ensure deadlines are met.
General Overview of Gantt Charts
Visualization Name: Gantt Chart
Visualization Category: Temporal
Types of Gantt Charts
- Basic Gantt Chart: Visualizes tasks and their timelines without additional details like dependencies or progress.
- Resource Gantt Chart: Includes resource assignments for tasks, showing who is responsible for each task.
- Progress Gantt Chart: Tracks task completion using progress indicators, such as percentages or shading.
- Dependency Gantt Chart: Displays task dependencies using connecting lines or arrows to show relationships.
- Interactive Gantt Chart: Allows users to update tasks, deadlines, or dependencies dynamically through drag-and-drop features.
Definition of Use Case
Gantt charts are primarily used to plan, monitor, and manage projects by breaking them into tasks, assigning resources, and tracking progress. They are essential for keeping teams aligned and ensuring projects are completed on time.
Why Use a Gantt Chart?
Gantt charts provide a clear visual representation of tasks, timelines, and dependencies, making them an indispensable tool for project management. They help teams stay organized, prioritize tasks, and identify potential bottlenecks.
Significance in Data Analysis
Gantt charts offer valuable insights into project schedules, resource allocation, and task dependencies. By visualizing these elements, project managers can make informed decisions to optimize workflow and minimize delays.
Structure and Components of a Gantt Chart
Key Elements
- Tasks: Represented as rows in the chart, with each task associated with a horizontal bar indicating its duration.
- Timeline: Runs horizontally along the top or bottom of the chart, marking dates and time intervals.
- Bars: Represent the start and end dates of tasks, with lengths corresponding to task durations.
- Dependencies: Arrows or lines connecting tasks to indicate relationships or sequences.
- Milestones: Special markers for key dates or events, such as deadlines or project phases.
Usage Scenarios
When to Use a Gantt Chart?
- Project Planning: Visualizing project timelines, key milestones, and task dependencies.
- Resource Management: Assigning resources and monitoring workloads for team members or departments.
- Task Tracking: Monitoring task progress and identifying delays or bottlenecks in workflows.
- Event Planning: Scheduling event activities, from setup to execution, with specific deadlines.
- Software Development: Managing Agile or waterfall development cycles with clear task assignments and deadlines.
When Not to Use a Gantt Chart?
- Simple Task Lists: For straightforward tasks without dependencies, a checklist or table is more efficient.
- Dynamic Processes: Use Kanban boards or process flow diagrams for tasks without fixed start and end dates.
- Large-Scale Data: Gantt charts can become cluttered with too many tasks or subtasks; consider summarizing data first.
- Real-Time Monitoring: Dashboards with dynamic data visualizations may be better for real-time tracking.
- Hierarchical Data: Treemaps or hierarchical charts may be more suitable for visualizing structured data with multiple levels.
Interpretation Guidelines
- Read the Timeline: Start by understanding the timeline at the top or bottom of the chart to interpret task durations.
- Identify Task Bars: Observe the position and length of bars to understand task start and end dates.
- Analyze Dependencies: Look for arrows or lines between tasks to identify sequences or dependencies.
- Focus on Milestones: Pay attention to key markers that represent critical deadlines or project phases.
- Monitor Progress: Use progress indicators or shaded bars to evaluate task completion percentages.
Strengths and Weaknesses of Gantt Charts
Advantages
- Comprehensive Visualization: Provides a clear overview of tasks, timelines, and dependencies in one place.
- Easy Progress Tracking: Enables quick identification of completed, in-progress, or delayed tasks.
- Improves Collaboration: Aligns teams by providing a shared understanding of project timelines and responsibilities.
- Customizable: Allows for adding milestones, task priorities, and resource assignments to fit specific needs.
- Encourages Planning: Helps teams think through project steps, dependencies, and potential risks before execution.
Limitations
- Overwhelming for Large Projects: Can become cluttered with too many tasks or complex dependencies.
- Time-Consuming Setup: Requires significant effort to create and maintain for detailed projects.
- Static Nature: Traditional Gantt charts may not adapt well to frequent changes in schedules or priorities.
- Dependency on Accurate Estimates: Effectiveness relies heavily on accurate task durations and resource allocations.
- Limited Real-Time Insights: Not ideal for tracking dynamic or real-time project changes without additional tools.
Design Best Practices
- Prioritize Clarity: Use consistent colors, fonts, and labeling to ensure readability and ease of interpretation.
- Group Related Tasks: Organize tasks into categories or phases to make the chart more structured and less cluttered.
- Highlight Dependencies: Use arrows or lines to clearly indicate relationships between tasks.
- Add Milestones: Include markers for critical dates or project phases to emphasize their importance.
- Regularly Update: Keep the chart current with any changes in task schedules, priorities, or progress.
Examples of Gantt Charts
Simple Examples
- Project Timeline: Visualizing the start and end dates of tasks in a small project, such as a marketing campaign.
- Event Planning: Scheduling activities for a conference, including setup, sessions, and teardown.
- Software Development: Managing development tasks like coding, testing, and deployment for a single feature.
- Team Workflow: Tracking tasks assigned to team members in a collaborative project.
- Personal Goals: Creating a timeline for completing personal tasks or milestones, such as learning a new skill.
Advanced Examples
- Enterprise Project Management: Visualizing multiple projects with interdependent tasks across teams or departments.
- Construction Planning: Mapping out the timeline for building phases, from groundwork to finishing touches.
- Product Launch Plan: Scheduling activities like development, marketing, and distribution for a product launch.
- Resource Allocation: Managing resources for a large project, ensuring tasks are aligned with team capacity and availability.
- Cross-Functional Collaboration: Coordinating tasks and dependencies among multiple teams for a large organizational initiative.
Comparison with Similar Visualizations
Similarities
- Gantt Chart vs. Timeline Chart: Both display tasks or events along a timeline, but Gantt charts focus on task durations and dependencies.
- Gantt Chart vs. Calendar View: Both visualize tasks by date, but Gantt charts highlight overlaps and dependencies.
- Gantt Chart vs. Resource Allocation Chart: Both can track task assignments, but Gantt charts emphasize schedules and timelines.
- Gantt Chart vs. Kanban Board: Both aid in task management, though Gantt charts focus on schedules, while Kanban boards visualize workflows.
- Gantt Chart vs. Milestone Chart: Both highlight key dates, but Gantt charts provide a more detailed view of task timelines and dependencies.
Differences
- Gantt Chart vs. Timeline Chart: Timeline charts are simpler and show events chronologically, while Gantt charts detail task durations and dependencies.
- Gantt Chart vs. Calendar View: Calendar views are best for scheduling specific days, while Gantt charts show overlapping timelines and dependencies.
- Gantt Chart vs. Resource Allocation Chart: Resource charts focus on workload distribution, while Gantt charts emphasize task scheduling.
- Gantt Chart vs. Kanban Board: Kanban boards are better for managing ongoing workflows, whereas Gantt charts are ideal for fixed project schedules.
- Gantt Chart vs. Milestone Chart: Milestone charts highlight critical dates only, while Gantt charts include detailed tasks and timelines.
Conclusion
Gantt charts are a cornerstone of project management, offering a comprehensive way to visualize tasks, timelines, and dependencies. Their flexibility and clarity make them invaluable for planning, tracking, and managing projects across industries. By following design best practices and keeping the chart updated, teams can optimize their workflows, meet deadlines, and achieve project goals efficiently.