A tree diagram is a hierarchical visualization that represents relationships between a central root node and its various branches or sub-nodes. It is commonly used to illustrate parent-child relationships, such as organizational structures, decision-making processes, or taxonomies. The structure of the diagram resembles a tree, with the root representing the origin of data and branches expanding outward to show connections and dependencies.
General Overview of Tree Diagrams
Visualization Name: Tree Diagram
Visualization Category: Hierarchy
Types of Tree Diagrams
- Horizontal Tree Diagram: Displays the hierarchy from left to right, with the root on the left and branches extending horizontally.
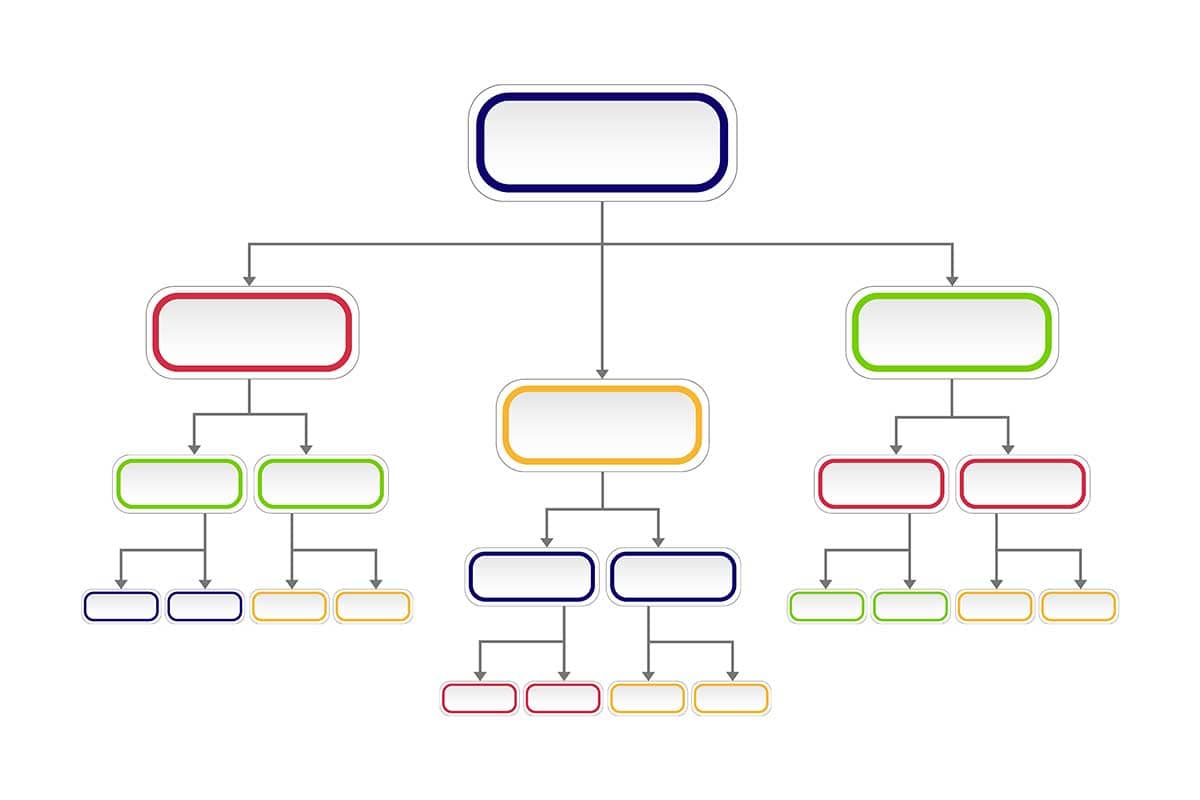
- Vertical Tree Diagram: Displays the hierarchy from top to bottom, with the root at the top and branches extending downward.
- Radial Tree Diagram: Arranges nodes in a circular layout, radiating outward from a central root.
- Collapsible Tree Diagram: Interactive tree diagrams that allow users to expand or collapse branches for detailed exploration.
- Clustered Tree Diagram: Groups similar nodes together to emphasize shared relationships or categories.
Definition of Use Case
Tree diagrams are used to visualize hierarchical relationships, such as organizational charts, decision trees, taxonomies, or family trees. They are ideal for exploring dependencies, classifications, and workflows.
Why Use a Tree Diagram?
Tree diagrams provide a clear and intuitive way to understand hierarchical relationships and structures. Their branching design allows viewers to trace paths, identify relationships, and explore connections between components.
Significance in Data Analysis
Tree diagrams are essential for representing and analyzing hierarchical data. They help identify patterns, dependencies, and relationships within datasets, making them valuable for tasks like decision-making, project planning, and process optimization.
Structure and Components of Tree Diagrams
Key Elements
- Root Node: Represents the starting point or central entity in the hierarchy.
- Branches: Lines connecting nodes that represent relationships or pathways between parent and child nodes.
- Child Nodes: Nodes that branch out from a parent node, representing subcategories or dependencies.
- Leaf Nodes: The terminal nodes at the end of branches, representing the final entities in the hierarchy.
- Labels: Provide descriptive information for nodes and branches, aiding interpretation.
- Color Coding: (Optional) Differentiates categories, groups, or levels within the tree for enhanced clarity.
Usage Scenarios
When to Use a Tree Diagram?
- Organizational Structures: Visualizing company hierarchies, team structures, or departmental workflows.
- Decision Analysis: Representing decision-making processes, such as “if-then” scenarios or cost-benefit evaluations.
- Taxonomy Representation: Mapping classifications, such as biological species, file systems, or product categories.
- Family Trees: Tracing ancestral relationships and lineage in genealogy.
- Process Mapping: Analyzing workflows, supply chains, or project dependencies.
When Not to Use a Tree Diagram?
- Flat Data: Use bar charts or tables for data without hierarchical relationships.
- Dense Networks: Use network diagrams or matrix charts for highly interconnected datasets.
- Non-Hierarchical Data: For data with no clear parent-child relationships, use scatter plots or heatmaps instead.
- Exact Quantitative Comparisons: Use bar charts or line charts for detailed numerical comparisons.
- Time-Series Data: Use line charts or area charts for trends over time.
Interpretation Guidelines
- Identify the Root: Begin by locating the root node, which serves as the central starting point of the hierarchy.
- Follow the Branches: Trace the paths from the root to explore parent-child relationships and dependencies.
- Examine Node Levels: Observe the depth of the tree to understand the hierarchy’s complexity and structure.
- Analyze Leaf Nodes: Focus on terminal nodes to interpret the final outcomes, categories, or entities.
- Use Color and Labels: Leverage color coding and text labels to identify categories, levels, or specific entities within the tree.
Strengths and Weaknesses of Tree Diagrams
Advantages
- Intuitive Structure: The branching design makes hierarchical relationships easy to understand and navigate.
- Scalable: Suitable for both small and large hierarchies, with interactive features enabling deeper exploration.
- Customizable: Supports variations such as radial layouts, collapsible branches, and color coding for enhanced insights.
- Highlights Dependencies: Effectively illustrates workflows, classifications, or decision paths.
- Versatile Applications: Applicable across industries, from project management to scientific research.
Limitations
- Clutter with Complexity: Becomes hard to interpret with overly dense or deeply nested hierarchies.
- Static Representation: Non-interactive tree diagrams may lack the depth needed for exploring large datasets.
- Space-Intensive: Requires significant space for large hierarchies, especially in horizontal or radial layouts.
- Single Parent Limitation: Assumes a single parent for each node, which may not be suitable for networks with multiple relationships.
- Requires Logical Ordering: Depends on a well-defined structure or hierarchy to be effective.
Design Best Practices
- Limit Complexity: Focus on key nodes and branches to reduce clutter and maintain readability.
- Use Consistent Labels: Ensure all nodes and branches are labeled clearly and concisely.
- Incorporate Interactivity: Add collapsible or zoomable branches to allow viewers to explore large hierarchies dynamically.
- Apply Color Coding: Differentiate levels, categories, or groups with distinct colors for better interpretation.
- Organize Layout Strategically: Choose the layout (horizontal, vertical, or radial) that best suits the data and viewing context.
Examples of Tree Diagrams
Simple Examples
- Company Hierarchy: Visualizing the organizational structure of a business with departments and teams.
- Decision Tree: Mapping out a series of decisions and their possible outcomes in a process.
- Biological Taxonomy: Representing the classification of species in biology, from domain to species.
- File System: Visualizing folders and subfolders in a computer directory.
- Family Tree: Tracing ancestry and relationships within a family.
Advanced Examples
- Project Management: Mapping task dependencies, milestones, and deliverables in a project workflow.
- Scientific Research: Representing the hierarchy of hypotheses, methods, and results in an experimental study.
- E-commerce Categories: Visualizing product categories, subcategories, and individual items in an online store.
- IT System Architecture: Mapping software modules, servers, and dependencies in a network or system.
- Customer Segmentation: Representing customer groups and their subdivisions based on behavior or demographics.
Comparison with Similar Visualizations
Similarities
- Tree Diagram vs. Sunburst Chart: Both represent hierarchies, but tree diagrams use a linear branching layout, while sunburst charts use a radial layout.
- Tree Diagram vs. Treemap: Both display hierarchical data, though treemaps use nested rectangles to show proportions.
- Tree Diagram vs. Organizational Chart: Both visualize hierarchies, with tree diagrams offering more flexibility in layout styles.
- Tree Diagram vs. Flowchart: Both illustrate processes, but tree diagrams focus on hierarchical relationships, while flowcharts emphasize workflows.
- Tree Diagram vs. Network Diagram: Both visualize connections, but tree diagrams are specific to hierarchical data, whereas network diagrams show all types of connections.
Differences
- Tree Diagram vs. Sunburst Chart: Sunburst charts are better for visualizing proportions, while tree diagrams are more suitable for exploring detailed hierarchies.
- Tree Diagram vs. Treemap: Treemaps prioritize space efficiency, while tree diagrams emphasize clear branching paths.
- Tree Diagram vs. Organizational Chart: Organizational charts are specific to teams and structures, while tree diagrams are versatile for any hierarchical data.
- Tree Diagram vs. Flowchart: Flowcharts are ideal for step-by-step processes, while tree diagrams focus on parent-child relationships.
- Tree Diagram vs. Network Diagram: Network diagrams handle multiple connections per node, while tree diagrams are limited to single-parent hierarchies.
Conclusion
Tree diagrams are an effective tool for visualizing hierarchical relationships and dependencies in a structured and intuitive format. Their versatility and clarity make them ideal for applications ranging from organizational charts to decision-making frameworks. By following best practices and tailoring the design to the dataset, tree diagrams can provide valuable insights and enhance data-driven decision-making across industries.